

.png)
Most conversations about AI analytics focus on the model layer. Which LLM to use? How to architect the agent. What framework to build on? These are real decisions, but based on what we're seeing in our work and what industry benchmarks consistently show, they account for a fraction of whether an implementation actually succeeds.
The bigger factor is context.
OpenAI has 70,000+ datasets, 600 petabytes of data, and some of the world's best engineers. They still couldn't just point AI at their data and get trustworthy answers. Their team shared how they built their in-house data agent, and the most striking part wasn't the AI itself; it was the foundation they had to build first. Six layers of context, from table-level knowledge to human annotations to institutional memory, all before the agent could return a number anyone should trust.
The benchmarks tell the same story. In 2023, a landmark benchmark from Juan Sequeda and the data.world team showed that adding structured semantic knowledge to enterprise databases improved LLM accuracy from 16.7% to 54.2% in their research. More than tripling the success rate.
The dbt Labs team replicated this on their Semantic Layer and hit 83% accuracy. They also found something that directly echoes our experience: adding a single well-written natural-language description to a field increased the accuracy of several questions from 0% to 100%.
As we start helping our clients enable AI agents in their analytics workflows, we decided to test it ourselves to inform our opinions during client implementations. We ran a structured experiment to measure exactly how much each layer of context enrichment contributes to agent accuracy. We tracked every change, measured the impact against a set of verified business questions, and the results reinforced what the benchmarks suggest: the model isn't the bottleneck. The context is.
AI models are remarkably good at generating SQL from natural language. The foundational capability is there. What they lack is institutional knowledge, the kind of context that a human analyst accumulates over months of working with a dataset.
Things like: which status codes indicate a completed transaction versus a pending one. Which record types are actually internal administrative entries that should be excluded from customer-facing metrics. Which fields only get populated after a downstream process runs.
A human analyst learns these things through experience, tribal knowledge, and a few hard lessons where they reported the wrong number. An AI agent has none of that context unless you explicitly provide it.
That's the gap. And closing it is where the real work happens.
The implementation involved building an AI analytics agent for a medical clinic that could answer operational questions from clinical and admin leads.
Questions about patient appointment capacity, staff resource allocation, slot utilisation, and general patient interaction & clinical encounters metrics. The kind of questions that tell a clinic whether they're running efficiently and where they're leaving capacity on the table. These kinds of questions would previously require an analyst to write SQL, run a query, format the results, and send a summary.
We approached it the way we approach any data problem at Data Culture: diagnose before you prescribe. Rather than jumping to model selection and prompt engineering, we wanted to understand which investments in the data context actually move the needle on accuracy. So we designed a structured experiment.
We started with a set of 13 golden questions, real business questions that stakeholders would ask, each with a verified correct answer. Then we ran the agent through a series of iterations, adding one layer of context at a time, and, using our internally built evaluation framework, measured whether it produced the correct answer after each change.
Here's a preview of the context layers we tested, in the order we applied them:
Each layer is independent and measurable. We tracked two metrics throughout: SQL generation rate (did the agent produce a query at all?) and accuracy (did the query return the correct answer?). More on what those mean shortly.
Here's what happened.
We pointed the agent at the raw source tables with no documentation, no descriptions, no business logic encoded anywhere.
SQL generation: 0% | Accuracy: 0%.
A quick note on these two metrics before going further. *SQL generation rate* measures whether the agent produced a syntactically valid query. It's a measure of whether the agent could even attempt the question. *Accuracy* measures whether the query returned the correct result against our expected verified answers. You can have high SQL generation and zero accuracy, as we'll see shortly.
In this iteration, the agent couldn't generate a single query. It had no idea which tables to use, how they related to each other, or what any of the columns meant. This might seem surprising, shouldn't it at least attempt something? For a well-structured database with intuitive naming, it probably would. But the underlying raw tables here were genuinely complex, with non-obvious relationships and no naming conventions that would let a model infer structure. The agent had no idea which tables to use, how they related to each other, or what any of the columns meant. This is the equivalent of handing a brilliant new hire a database login on their first day with no onboarding whatsoever. They can query anything. They understand nothing.
We gave the agent a clean, well-structured analytical table instead of raw sources. One table, properly joined, with clear column names. But no descriptions, no business context, no documentation beyond the column names themselves.
SQL generation: 38.5% | Accuracy: 0%.
The agent could now attempt some questions. The clean structure gave it enough to work with. But without knowing what the fields actually meant in context, it got the logic wrong on every single query. It used the wrong status field. It included internal entries in customer-facing counts. It didn't know which records should be excluded from capacity calculations.
Interestingly, when we ran a parallel experiment on a second dataset, a retail business with more standardised naming conventions, modelled data alone produced notably higher (80%) SQL generation at this stage. This aligns with the intuition that well-named columns in familiar domains act as a lightweight substitute for descriptions. A field called total_revenue in a retail schema is largely self-explanatory. A field called slot_status in a clinical scheduling system is not.
The more specialised your domain, the less you can lean on naming alone, and the more critical explicit descriptions become in the next layer.
The agent was technically functional. Contextually, it was still completely lost.
We had a field called slot_status with two possible values, Open and Filled. One of the test questions asked for the total number of available slots. The agent correctly identified slot_status as the relevant field, but filtered for slot_status = 'Available' , a value that doesn't exist in the data. Without a description telling it that Open means available, the agent guessed based on the question's language rather than the data's vocabulary. The query ran without errors. It returned zero results. And nothing about the output signalled that anything was wrong.
This is a pattern worth pausing on. Most data professionals have seen this exact failure mode in human-built reports, numbers that are technically correct based on the query logic but misleading because the analyst didn't understand the business context. AI agents fail in the same way, just faster and more often.
This iteration step validates the common knowledge that the success of an AI agent in analytics is fundamentally dependent on a well modeled data.
Good data modeling is the semantic layer. When your tables are well-named and your joins are straightforward, the LLM has everything it needs. Clean up your data model. That's the highest-ROI investment you can make. ~ Jacob Matson
This is where things changed.
We wrote detailed descriptions for every column in the semantic model. Not the auto-generated kind that says "The status of the record," which tells the agent nothing useful. Instead, descriptions that explained what each field means, how the agent should use it, and what to watch out for.
For example, instead of:
"The status of the order."
We wrote:
"The lifecycle status of the order derived from fulfillment and payment timestamps. 'Completed' means the order was fulfilled and delivered. Use this for revenue and fulfillment analysis. 'Pending' means payment was received but the order has not yet shipped. 'Cancelled' means the customer cancelled before shipment. Do not use this field to determine if inventory was allocated, use allocation_status instead."
The first description names the column. The second one teaches the agent how to think about the domain.
Result: 100% SQL generation rate, 15% accuracy.
Every question now got a SQL query. The agent had enough context to attempt everything. But the queries were still producing wrong numbers in most cases. Wrong filters, wrong groupings, wrong metric calculations.
The descriptions gave the agent vocabulary. It still needed grammar.
We added explicit instructions encoding the business logic that descriptions alone couldn't convey. Rules like:
These are the rules that exist in an analyst's head. The ones they learned the hard way after reporting a wrong number and getting corrected by finance or operations. We made them explicit and machine-readable.
Result: 100% SQL generation, 77% accuracy.
The jump from 15% to 77% came entirely from encoding business rules. No model change. No prompt engineering trick. Just writing down the institutional knowledge that was previously undocumented.
This is worth emphasising. The single largest accuracy improvement in the entire experiment came from documenting what the team already knew but had never formalised. The knowledge existed. It just lived in people's heads instead of in the data layer.
We added pre-defined metric formulas, standardised calculations for the domain's core KPIs, and a few verified example queries for complex patterns the agent still struggled with. We also refined the evaluation pipeline itself.
This is where we learned something unexpected. Several answers that were being marked as incorrect were actually correct but expressed differently: different column names, different column ordering, and minor decimal formatting differences. Fixing the measurement revealed accuracy that was already there.
Result: 100% SQL generation, 92% accuracy.
The remaining 8% was one question the agent still answered differently from expected, a legitimate edge case that we documented for future iteration.
Here's the full progression:
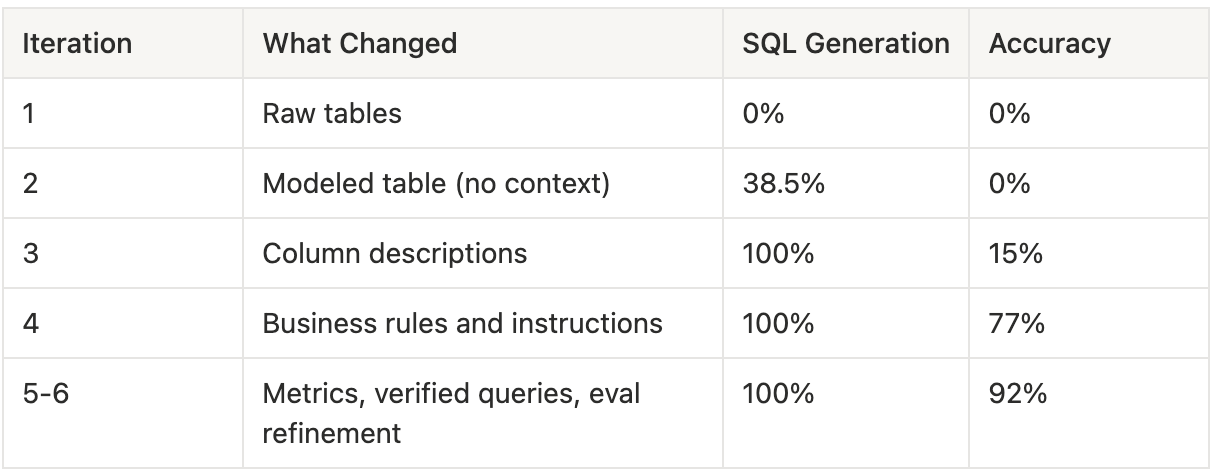
A few things stand out.
The single biggest jump came from writing column descriptions. SQL generation increased from 38.5% to 100%, a 61.5 percentage-point improvement in a single enrichment step. Descriptions are the highest-leverage investment in the entire process.
The second biggest jump came from encoding business rules. Accuracy went from 15% to 77%. The agent already knew the vocabulary from the descriptions. The instructions gave it the grammar, the rules for how to combine those concepts correctly.
The model never changed. From Iteration 1 to Iteration 6, we used the same underlying LLM. Zero prompt engineering beyond context enrichment. The improvement was entirely driven by the quality of the context layer surrounding the model.
Fixing the measurement mattered too. About 23 percentage points of the final accuracy came from answers that were correct throughout, but our evaluation pipeline couldn't verify them because of trivial formatting differences. The agent was better than we thought. We only discovered this after investing in a more robust comparison methodology.
That last point is worth sitting with. The quality of your evaluation directly affects the quality of your iteration. If the measuring instrument is off, every experiment you run produces misleading signals.
These findings align with the latest industry benchmarks. When dbt Labs reran the Sequeda benchmark in April 2026 with the latest foundation models, raw text-to-SQL accuracy reached 90% in some configurations. But the Semantic Layer still outperformed, approaching 100% for questions within its scope. Even the best models in 2026 still need well-modelled data and rich context. The models got better at telling you that your boring work isn't done yet
The reason is structural. AI analytics agents are, at their core, text-to-SQL systems. They translate natural language questions into database queries. The translation quality depends on two things: the model's ability to write SQL, which is already quite good, and the model's understanding of what the data means, which starts at zero for every new dataset.
Most teams invest heavily in the first capability and underinvest in the second. They evaluate models, compare frameworks, and optimise prompts. Then they point the chosen agent at a data warehouse with minimal documentation and wonder why the answers are wrong.
The model wasn't the bottleneck. The context was. This is also why concepts like ontology and knowledge graphs are gaining traction in data conversations right now; they're formal approaches to encoding the kind of business meaning and entity relationships that our experiment showed AI agents desperately need but rarely get.
If you think about this through the lens of where to invest for the highest return, the answer is clear. Improving the model from 90% SQL capability to 95% is incremental. Improving the context layer from sparse to rich is transformational. The leverage is asymmetric, favouring the boring work.
If you're building or evaluating an AI analytics agent, here's the practical framework we've developed. The order matters. Each layer builds on the previous one, and skipping ahead tends to produce worse results than building sequentially.
Start with a clean, well-structured analytical layer. The agent shouldn't be querying raw source tables with cryptic column names and undocumented joins. A modelled table with clear naming, proper grain, and pre-computed business logic gives the agent a solid foundation. Our experiment showed this alone enabled 38.5% SQL generation, not great, but the floor that everything else builds on.
For every field the agent will encounter, write a description that answers three questions: What does this field contain? How should the agent use it? What should the agent watch out for? Include sample values. Flag fields that have a closed set of known values. Explain relationships between related fields. This was the single highest-impact layer in our experiment, the difference between an agent that can't answer questions and one that attempts all of them.
Encode the institutional knowledge that lives in your team's heads. Default filters that should always be applied. Date handling conventions. Which records to include or exclude for different types of analysis. These are the rules a new analyst would learn in their first month on the job. The agent needs them on day one.
Create pre-built calculations for your most important business KPIs. When the agent has a pre-defined formula for a core metric, it uses that formula consistently rather than improvising one each time. This is especially important for metrics where the calculation isn't obvious from the column names alone, such as ratios, weighted averages, and anything with a non-trivial denominator.
For complex query patterns that the agent still struggles with after layers 1-4, provide verified example queries. These teach the agent specific patterns it can generalise from. Use sparingly; the goal is to cover patterns, not memorise individual questions.
None of the above matters if you can't measure whether it's working. Build an evaluation pipeline that runs the agent against a set of verified questions and compares the actual results — not just the SQL structure, but the numbers that come back. If you can't measure improvement, you can't iterate. And if you can't iterate, the agent stays stuck wherever it landed on day one.
One important note on this framework: start small. You don't need to boil the ocean. Layers 1 through 4, a clean data model, rich descriptions, documented business rules, and defined metrics, can be built incrementally using what your team already knows. Each layer is independently measurable, so you can evaluate the impact of each step before investing in the next.
As the foundation matures, there's room to scale beyond what lives in your tables.
All of this can eventually enrich the agent's understanding. But that's the destination, not the starting point. Start with your column descriptions. Measure the impact. Build from there.
There's a reason this work doesn't get the attention it deserves. Writing column descriptions isn't exciting. Conference talks on agent architectures draw larger crowds than talks on data documentation.
But the data tells a consistent story, from our experiment, from the Sequeda benchmark, from the dbt Labs findings.
The teams winning with AI analytics are the ones doing the boring work.
They're writing descriptions, encoding business rules, defining metrics, and building evaluation pipelines. They're treating the context layer as the product rather than the model.
I've written before about how the data industry is being pulled toward a world where judgment and domain expertise matter more than pure technical execution. This is a concrete example of what that looks like in practice. The technical capabilities of AI models are impressive and improving rapidly. But the judgment required to tell those models what your data actually means, that's irreducibly human work. And it's the work that makes the difference between a demo and a deployment.
The organisations that recognise this early will have a meaningful head start. Not because they chose a better model, but because they invested in the context that makes any model useful.
And that starts with the boring work.
If your team is exploring AI analytics and wants to understand whether your data foundation is ready, Data Culture offers an AI Readiness Assessment that evaluates your current setup across data quality, semantic context, and organisational readiness.

