




There are a few different pieces involved in building an analytics agent that I would actually be comfortable putting in front of someone.
The model is one piece. The data models are another. You also need business context, some way for the model to interact with the data, and, if you want to know whether the thing actually works, a way to inspect what happened after each question.
As part of the team that created the open source data agent repo, I worked on the agent layer for that work. The broader project starts with a dbt project and an AGENTS schema that exposes governed business context, model documentation, column definitions, and the marts the agent is allowed to query. On the other side is an evaluation layer that takes the outputs of the agent and checks whether it arrived at the right result
This article will focuses on what sits between the foundational data layer and the evaluation layer, which is the agent layer, the bolt that connects and makes everything work.
The job of the agent layer is fairly simple to describe:
The implementation was intentionally kept fairly basic. The goal was not to build a production-ready analytics product with memory, routing, multiple tools, and a long list of agent features. It was to build enough of an agent layer to make the full system work end to end and, more importantly, make the agent's behavior inspectable and evaluable.
The agent layer is the part that turns the governed data setup into something a user can actually interact with.
It sits above the AGENTS schema. A question comes in, the agent works through the context and tools available to it, executes the query it needs, and returns a structured result that can be evaluated downstream.
Natural-language question
↓
Agent layer
↓
Governed context + tools
↓
SQL
↓
Query execution
↓
Answer + SQL + result + run metadata
That is the scope of the agent layer in this project. The data layer provides the business context and the analytical surface the agent can work with.
Starting with context
Once the scope of the agent layer was clear, one of the first things to work out was how the model would understand the data environment it was operating in.
The AGENTS schema is the source of that context. It contains the business definitions, the exposed dbt models, their documented columns, and the metadata the agent needs to understand what it can query and how those models should be used.
Rather than loading all of that into the application instructions, the agent discovers it at runtime.
It starts with agents.root:
select
provider,
key,
content
from agents.root
order by
provider,
key
That acts as the router.
From there, the agent reads the business context, inspects the exposed models in agents.dbt_model, reads the documented columns for the marts it intends to use from agents.dbt_column, and then writes the analytical query.
agents.root
↓
business context
↓
agents.dbt_model
↓
relevant models
↓
agents.dbt_column
↓
relevant columns
↓
query the marts
The order matters because knowing which tables and columns exist is not the same thing as knowing how the business defines a metric.
A model can find fields like freight_amount, gmv_amount, and tov_amount and still construct a reasonable-looking calculation that does not match the governed definition. The same applies to rules around completed orders, reporting timestamps, or which grain should be used for a particular metric.
That is why the instructions make the discovery path explicit. The agent reads the business context first, understands the available models and their grain, then inspects the documented columns before writing the analytical query.
The instructions also tell the agent to prefer documented helper columns over recreating the same logic itself. If the mart already provides something like is_completed or a localized purchase timestamp, the agent should use those rather than rebuilding that logic in SQL.
The overall contract is intentionally simple: understand the governed context first, understand the available data next, and only then query it.
Once the model knows what it needs, it still needs a way to query the data.
For this project, that boundary is MCP.
The orchestrator connects the model to DuckDB through an MCP toolset and exposes an execute_query tool. The model can use that tool while working through a question, inspect the result, adjust its approach if needed, and eventually return its final answer.
At a high level:
┌──────────────┐
Question ───────▶│ LLM │
└──────┬───────┘
│
MCP tool call
│
▼
execute_query
│
▼
DuckDB
MCP solves the tool interface, but I did not want MCP access to mean unrestricted database access.
The application wraps the query tool with its own controls.
Only execute_query is allowed. SQL has to be a single SELECT statement. The query plan is inspected before execution, and relations outside the exposed marts and the curated agents.* metadata tables are rejected.
That means the model can read the metadata it needs for discovery and query the marts it needs for analysis, but it cannot wander through staging models, intermediate tables, information_schema, or arbitrary external data sources.
There is also a second validation step that I think is worth calling out.
The SQL included in the agent's final structured response is model-controlled. It may not necessarily be identical to the last query the model executed while reasoning through the question.
So before that final SQL is executed and its result is saved, it goes through the governance checks again.
It is a small implementation detail, but it closes a fairly obvious gap. It is not enough to validate only the intermediate tool calls if you are going to treat the final SQL as the canonical output of the agent.
MCP gives the model tools, but there is still an orchestration layer around that interaction.
I used Pydantic AI for that part of the implementation.
The orchestrator wires together three things:
Model
+
Governed instructions
+
MCP toolset
For each question, it manages the model run, tool calls, retries, and usage limits.
There are a couple of practical controls around this.
The number of model requests is capped so a bad question or confused model cannot get stuck in an endless tool loop. SQL errors can also be returned to the model so it has a limited opportunity to correct the query rather than immediately failing the entire run.
Neither of these is particularly sophisticated, and that was intentional. This was meant to be a clear reference implementation that makes the moving parts easy to see rather than a heavily abstracted production agent.
One of the more important decisions in the agent layer was what it should return.
If this were only a chat interface, something like this might be enough:
Total GMV was R$X.
But that is a fairly poor interface for the rest of the system.
If the agent is going to be evaluated, debugged, compared across models, or monitored later, I need to know more than what it said.
So the model itself returns a structured answer containing:
answer
final SQL
whether it declined or clarified
the main metric queried
The agent layer then adds the execution information around that answer.
A complete run captures things like:
{
"question_id": "...",
"question": "...",
"model": "...",
"agent_response": "...",
"agent_sql": "...",
"agent_result": [],
"tool_calls": [],
"n_requests": 0,
"metric_queried": "...",
"declined_or_clarified": false,
"tokens": 0,
"cost": 0,
"duration_ms": 0,
"error": null,
"error_type": null
}
There are two different reasons for doing this.
The first is evaluation.
The downstream evaluator needs the SQL and the canonical query result. A prose answer alone is not enough to determine whether the agent got the underlying data right.
The second is understanding the agent itself.
If a run fails, I want to know whether the model chose the wrong metric, made six unnecessary tool calls, generated invalid SQL, exceeded its request limit, or simply took much longer than another model to reach the same result.
Once you capture that information from the start, those questions become much easier to answer.
Another decision I made fairly early was not to tie the agent implementation to one model.
The configured model is just that: configuration.
The same agent can be run with another supported model without changing the orchestration, MCP tools, context-discovery process, or output contract.
That became useful for a second part of the work: comparing how lower- and higher-capability models behave inside the same agent architecture.
I was less interested in doing a generic model benchmark.
There are already plenty of those.
The more useful question for this project was:
If everything around the model stays the same, how much does model capability affect the performance of the analytics agent?
That is a slightly different test.
Before running the full benchmark, a few development traces gave an early indication of what was worth measuring.
Take a fairly straightforward question:
How many completed orders did we have in January 2018?
Both GPT-5 Nano and GPT-5 returned 7,191 completed orders.
At the answer level, that looks like a tie.
The traces tell a different story.
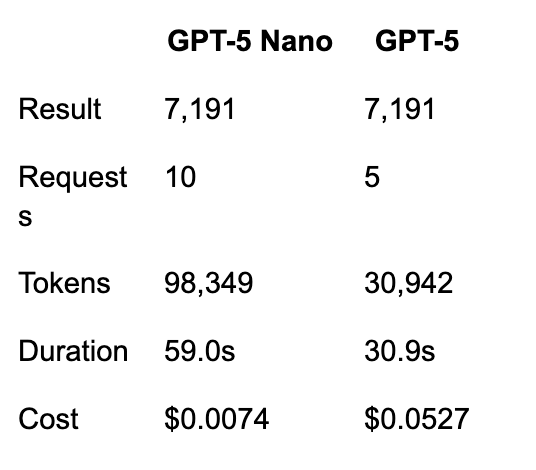
GPT-5 reached the same result with half the model requests and less than a third of the token usage. It was also faster in that run.
Nano was still much cheaper.
That is already more useful than saying both models got the question right.
A second question exposed something more important:
What was the month-over-month GMV growth rate for 2017?
Here the two models did not just take different paths.
GPT-5 used the order-item grain, filtered to completed orders, and bucketed the data using purchased_at_sao_paulo, which is the documented timestamp for month-level reporting.
Nano used the same GMV field and completed-order filter, but its final query used purchased_at, the UTC timestamp.
The difference is subtle. The SQL runs. The monthly numbers look reasonable. But orders close to a month boundary can fall into a different month once the timestamp is converted to São Paulo time.
That resulted in slightly different monthly GMV values and therefore different growth rates.
The traces looked like this:
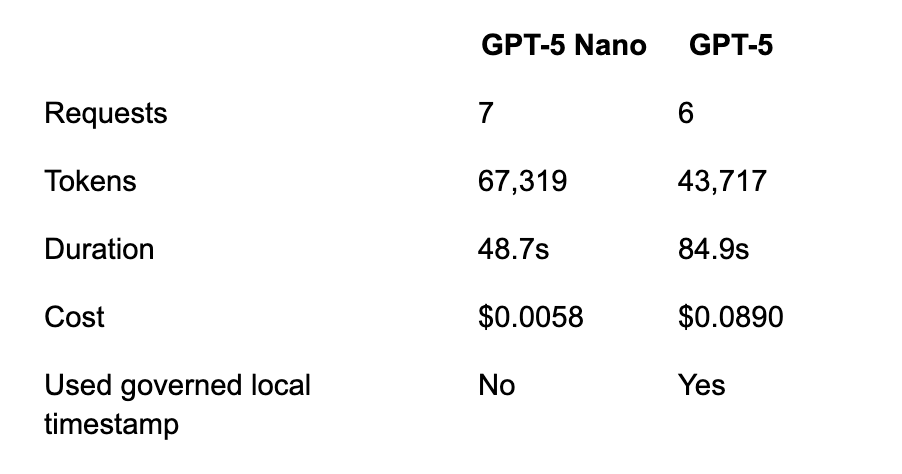
This is the type of difference I am more interested in than whether one model writes better prose.
Both models had access to the same governed context.
One followed an important reporting rule correctly. The other produced a plausible query that missed it.
These are still development traces rather than benchmark results, so I would not draw a broad conclusion from two questions. But they helped shape what the full comparison needs to capture.
The comparison itself is deliberately simple.
Keep these fixed:
Same questions
Same AGENTS schema
Same business definitions
Same marts
Same agent instructions
Same MCP tools
Same governance rules
Same output contract
Then change this:
Model
That is important because I want the comparison to tell me something about the model, not about two differently configured agents.
The golden question runner makes this fairly straightforward because the model can be overridden without changing the rest of the implementation.
And because every run already captures the same metadata, the comparison can go beyond pass or fail.
The main dimensions I care about are:
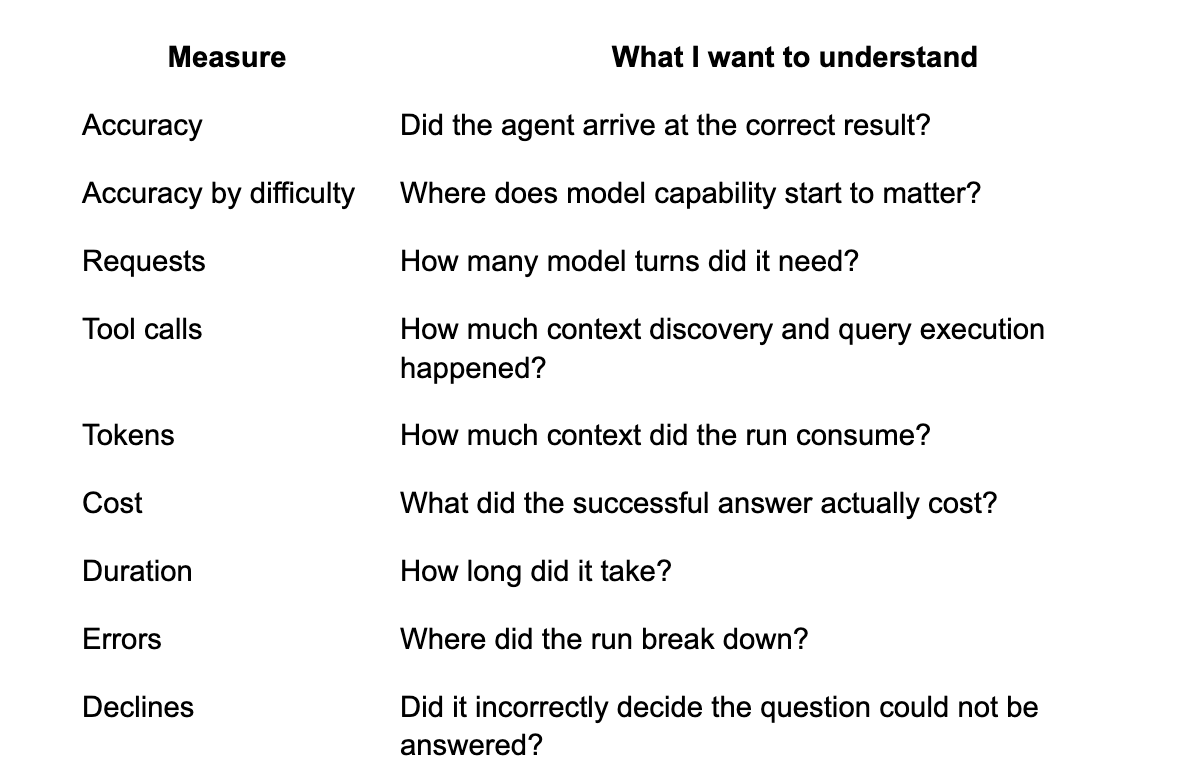
The part I would pay particular attention to is not simply which model has the higher overall score.
I want to know where the gap appears.
If both models perform similarly on straightforward aggregations but separate on questions that require more context discovery, careful grain selection, or less obvious business rules, that tells us something useful about where the stronger model is buying us more capability.
The cost numbers also need to be viewed alongside agent behavior.
A cheaper model is not necessarily cheaper at the system level if it consistently needs more requests, consumes much more context while exploring the schema, or retries queries more often.
At the same time, fewer requests and fewer tokens do not automatically make a stronger model cheaper. The January trace showed that quite clearly.
So one metric I am particularly interested in is cost per successful answer, rather than cost per model call.
Aggregate results are useful, but some of the most useful information is still in the individual traces.
For each model, I can inspect the actual sequence of tool calls:
Question
↓
read agents.root
↓
read relevant business context
↓
inspect models
↓
inspect relevant columns
↓
execute analytical query
↓
return final SQL and answer
For a straightforward question, the paths might look almost identical.
For a harder question, one model may identify the relevant mart quickly while another explores several models first. One may use an existing helper column while another reconstructs the same logic manually. One may recover cleanly from a SQL error while another burns through its request limit.
Those differences are difficult to see if the only thing you save is the final chat response.
They become fairly obvious once tool calls, requests, duration, SQL, and token usage are part of the output contract.
This implementation is intentionally a simple reference architecture rather than a complete production agent.
That simplicity was useful for this project. It kept the agent layer small enough that the behavior of the model, the context it retrieved, the SQL it generated, and the output passed into evaluation were all easy to inspect.
A production setup would naturally add more around it.
Model routing is one example.
If the benchmark shows that a lower-cost model performs reliably on simpler classes of questions while a stronger model is materially better on harder ones, there is an obvious opportunity to route questions rather than choosing one model for everything.
The run metadata also gives us the beginnings of production observability. Cost, latency, tool usage, errors, and model behavior can all be tracked over time rather than only during an offline evaluation run.
There is also more work to do around multi-turn interactions. The current agent is deliberately centered on answering one governed analytics question at a time, which keeps the evaluation surface clean. A conversational analytics agent introduces additional questions around session context, follow-up references, and whether assumptions from earlier questions should carry forward.
Those are useful next problems, but they were intentionally outside the scope of what I wanted this agent layer to prove.
